

What is LUCI?
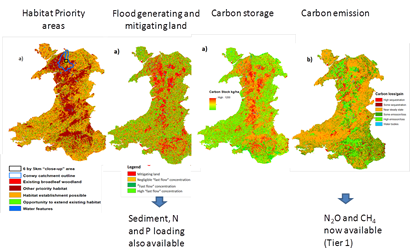
The Land Utilisation and Capability Indicator (LUCI) model allows the mapping of ecosystem services from the sub-field to national scale, the impact of management services on these services, likely trade-offs, and opportunities for spatially optimising interventions. Currently services include agricultural productivity, flood risk, erosion, nitrogen, phosphorus loss to rivers, carbon storage and emission rates, habitat diversity, and connectivity for broadleaved woodland species. All are available as colour coded maps highlighting low to high current levels of service delivery. In contrast to simple mapping approaches, LUCI is ‘process-based’ and includes our best scientific understanding. It can thus generate outputs beyond current data availability and report changes in meaningful units (e.g. kg of carbon, m3 of river flow etc).
All LUCI calculations and valuations are produced at the resolution of the input digital elevation model (DEM) - 5m x 5m within the UK. This is the obvious choice for water and diffuse pollution services and allows for sub-field management changes e.g. riparian strips and field boundaries as well as sub-catchment and catchment changes to be assessed. This resolution is continued for all services to ensure each service valuation is produced at a resolution consistent (identical) with the other service valuations. This common scale is also necessary to allow trade-offs and synergies to be meaningfully calculated. LUCI is a second generation extension and software implementation of the Polyscape framework described in Jackson et al (2013).
When and why would the tool be useful?
The LUCI tool is a reporting and decision support tool. Questions LUCI can answer include:
- Where are ecosystem services currently high in this farm/catchment/country?
- Where can I increase carbon sequestration with minimum loss to agricultural production and no loss of biodiversity?
- Where can I increase woodland cover in a way that maximises benefits for flood mitigation and water quality?
- What benefits am I getting in the landscape in areas beyond those actually modified?
- Where are trade-offs in service provision going to be an issue?
- What are the national outcomes from management interventions through an agri-environment scheme?
What is its relevance to the Ecosystem Approach and ecosystem services?
LUCI explicitly maps both individual services but also their interdependence and connectivity within the landscape. For example where trees are planted have impacts downslope on runoff and water quality, these impacts are able to be modelled due to powerful algorithms running in the background which are routing water. Different combinations of vegetation and soil type affect whether land becomes a sink or a source for carbon. Sediment from a ploughed field may not reach a river if there is land which captures the sediment between the field and the river.
The accessibility of a patch of woodland from another patch by a species depends on the ease with which that species can cross the land in between. Stakeholders can create their own rules which influence outcomes from LUCI such as – no change in carbon sequestration or no loss of priority habitat. There is no inherent judgement placed within the LUCI model as to which service is more valuable.
How do you work with the tool in practical steps?
At its simplest LUCI can run on just 3 data sources which are nationally available; a soils map, landcover map and a digital elevation map. As for all models and projects which depend on these datasets, license agreements are usually required before they can be used. Drop down menus ask for the data sources from different options and where you want the outputs to be stored. Services of interest need to be specified together with any management options to be explored. The model then runs and maps and tables are delivered. All methods underlying the model structure are available in the literature (e.g. Jackson et al. (2013).
To increase accessibility and usability of the model, work is going by Victoria University /CEH to make the model web-enabled with help boxes at every step plus computer resources for those who need it. Funding is being sought to speed up this process and develop a mobile app to increase accessibility and usability in the field.
View a good practice case study
Case: Study: National Evaluation of agri-environmental payments in Wales.
LUCI is being extensively used within the Welsh Government’s Glastir Monitoring and Evaluation £9M Programme (GMEP) over a 4 year period which takes an integrated ecosystem approach as its starting point. To our knowledge this is the largest monitoring and evaluation programme of any EU member state with respect to farmer payment outcomes. GMEP provides an independent scientific assessment of the changes in the Welsh countryside resulting from EU payments to farmers and land owners under the Glastir land management scheme. Glastir is the mechanism by which Welsh Government encourages farmers to change management practices to ensure greater environmental sustainability.
Five outcomes have been prioritised which are reducing the loss of biodiversity, mitigating climate change, improving water quality, increasing woodland area and improving management, and providing greater protection and access to the Welsh landscape and historic features.
The programme takes an ecosystem service approach recognising the potential for trade-offs and co-benefits of different management practices. A rolling monitoring programme is underway which samples the Welsh countryside on a 1km grid square measuring a wide range of different aspects of the countryside including plants, soils, waters, habitat, historic features, birds and pollinators recognising their inter-dependency. Land owner surveys are also being carried out to understand how land owners respond to the scheme and payments. A critical component of the GMEP programme is the use of a suite of models including the LUCI model to integrate our monitoring data to explore these trade-offs and co-benefits, upscale survey data to provide national estimates in meaningful units (e.g. kg of carbon, area of land mitigating flooding etc) and % change, and explore future scenarios to provide fast feedback to Welsh government as to likely success of Glastir.
The first GMEP year report will be released in March 2014. A major focus of the report is reporting on the model runs simulating the impacts of six scheme intervention measures on diffuse pollution, habitat connectivity, carbon stocks and sequestration, plant diversity and erosion and their trade-offs and synergies at a national scale. The three main models the GMEP project have used to date are the VUW/CEH LUCI ecosystem services model (which is a 2nd generation version of the Polyscape framework published in Jackson et al. (2013)), the ADAS Wales Diffuse Pollutant Emission Modelling Framework and the CEH plant species model MULTIMOVE.
Useful References
Bagstad, K.J., Semmens, D.J., Waage, S, Winthrop, R. (2013) A comparative assessment of decision support tools for ecosystem services quantification and valuation. Ecosystem Services 5, e27-e39.
Emmett, B.A. and the Wales AXIS II MEP Team (2013). An integrated ecological, social and physical approach to monitoring environmental change and land management effects: The Wales Axis II monitoring and evaluation programme . Aspects of Applied Biology, 118, Environmental Management on Farmland: 31–39.
Emmett and the GMEP team (2014) Glastir Monitoring and Evaluation Programme. First Year Annual Report to Welsh Government (Contract Reference: C147/2010/11). NERC/Centre for Ecology and Hydrology (CEH Project NEC04780), pp 393.
Jackson, B., Pagella, T., Sinclair, F., Orellana, B., Henshaw, A., Reynolds, B., McIntyre, N., Wheater, H. and Eycott, A. (2013) Polyscape: A GIS mapping framework providing efficiency and spatially explicit landscale-scale valuation of multiple ecosystem services. Landscape and Urban Planning, 112, 74-88.